Extracting meaningful insights from connected data requires understanding relationships, but managing operational and analytical graph workloads typically forces you to juggle separate databases, fragile data pipelines, and complex integrations. This fragmentation creates silos, drives up operational costs, and constrains scalability.
Google Cloud is introducing a unified graph database and analytics solution built on Spanner Graph and BigQuery Graph. The solution includes both platforms, deployment blueprints, and getting-started guides for common use cases. This article examines the solution's components, explores typical applications, and features insights from customers already using it in production.
Spanner Graph for operational workloads
Spanner Graph consolidates graph, relational, search, and generative AI capabilities into a single database, backed by Spanner's unlimited scalability, high availability, and strong consistency guarantees.
Core features include:
-
Integrated table-to-graph mapping: Define graphs directly over existing Spanner relational tables, enabling graph queries on operational data without duplication.
-
Interoperable graph and relational querying: Use ISO-standard Graph Query Language (GQL) for pattern matching, and combine GQL with SQL in a single query to traverse both graph and tabular data.
-
Advanced search and AI integration: Built-in vector search, full-text search, and Vertex AI integration enable semantic data retrieval and intelligent applications within the database.
Organizations are deploying Spanner Graph for high-throughput, low-latency applications including identity resolution across millions of entities, dependency mapping in complex environments, data lineage tracking, customer 360 implementations, and real-time fraud detection.
"Open Intelligence is our foundational intelligence layer that securely connects trillions of live data points from clients, partners and WPP in a privacy-first way and is now integrated and powers WPP's agentic marketing platform, WPP Open. Enabled by Google Cloud's Spanner Graph, Open Intelligence is a significant advancement in AI-driven marketing and we are excited about extending the use case for analytical graph workloads on BigQuery Graph." - Rob Marshall, Head of Strategy, Data & Intelligence, WPP
BigQuery Graph for analytical workloads
While Spanner Graph handles active operations, large-scale analysis requires exploring relationships across billions of nodes and edges to identify patterns in historical data. Graph workloads, like SQL workloads, benefit from specialized tools optimized for different scenarios.
BigQuery Graph brings connected data analytics into your data warehouse. Map existing BigQuery data to a graph schema and query it with SQL or GQL to uncover hidden relationships in massive datasets without data movement.
Key capabilities:
- Integrated table-to-graph mapping: Map BigQuery tables to graphs instantly, revealing hidden relationships in your data warehouse without ETL pipelines or data movement.
- Interoperable graph and relational querying: Apply GQL pattern matching to massive historical datasets, and combine SQL with GQL in a single query to leverage data warehouse familiarity alongside graph traversal.
- Advanced search and AI integration: Native BigQuery AI integration enables predictive analytics, while built-in vector search, full-text search, and geospatial functions help locate connected information across billions of records.
Spanner Graph and BigQuery Graph as a unified solution
While each platform delivers value independently, their combined deployment eliminates data silos and accelerates time-to-insight without compromising database performance.
"Spanner Graph enables Yahoo to unify our data into a connected foundation at a global scale, powering real-time, intelligent decision-making across our agentic advertising platform. This enhances our AI-driven approaches that drive one of the largest digital advertising ecosystems, and we look forward to building on it with BigQuery Graph to unlock deeper analytics and predictive capabilities to power future innovation." - Gabriel DeWitt, Head of Consumer Monetization, Yahoo
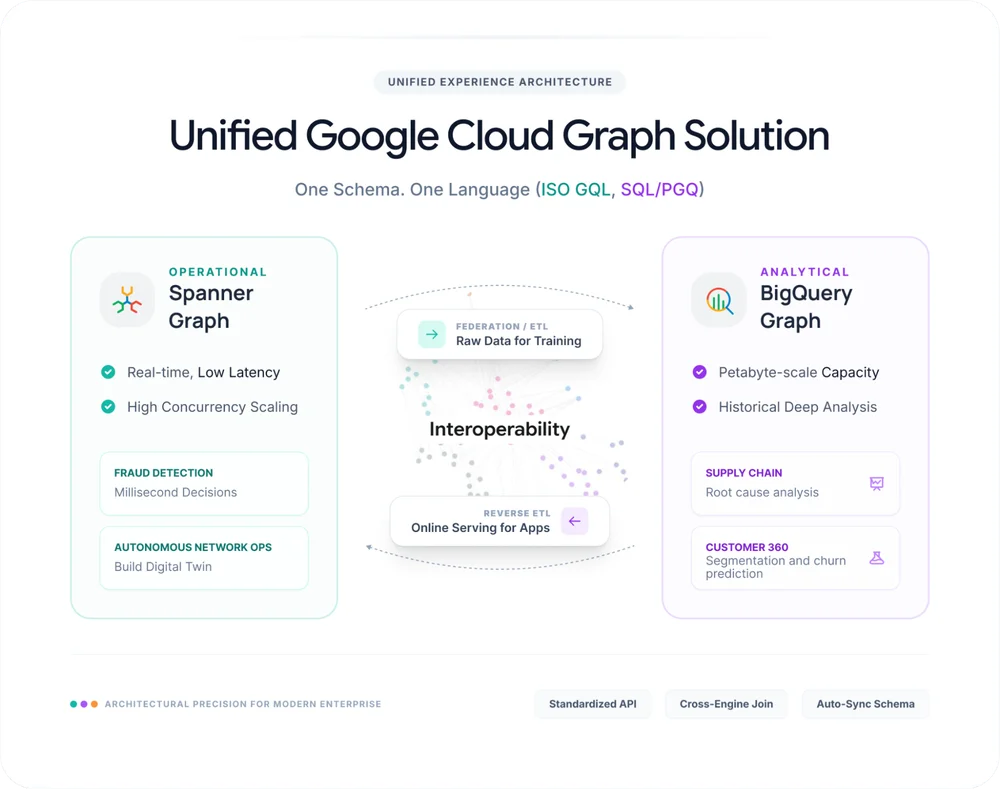
In financial fraud detection, for example, Spanner Graph can instantly identify a suspicious connection and block a transaction at checkout, while BigQuery Graph analyzes petabytes of historical transaction data to expose the complex fraud ring behind it.
The two engines integrate to create an end-to-end graph workflow:
1) A unified graph query and schema experience
The consistent schema and GQL shared across both platforms reduces development time and context-switching friction.
To find potential fraud rings originating from a specific account in real-time, use this Spanner Graph query:
- code_block
- <ListValue: [StructValue([('code', 'GRAPH FinGraph\r\nMATCH p=(:Account {id: @accountId})-[:Transfers]->{2,5}(:Account)\r\nRETURN PATH_LENGTH(p) AS path_length, TO_JSON(p) AS full_path;'), ('language', ''), ('caption', <wagtail.rich_text.RichText object at 0x7f0a213063a0>)])]>
To run the same analysis for all accounts involved in historical fraud rings, the BigQuery Graph query is nearly identical:
- code_block
- <ListValue: [StructValue([('code', 'GRAPH bigquery.FinGraph\r\nMATCH p=(:Account)-[:Transfers]->{2,5}(:Account)\r\nRETURN PATH_LENGTH(p) AS path_length, TO_JSON(p) AS full_path;'), ('language', ''), ('caption', <wagtail.rich_text.RichText object at 0x7f0a213064f0>)])]>
2) Query Spanner data in BigQuery Graph through Data Boost
With Data Boost, query Spanner Graph data directly from BigQuery without impacting transactional workload performance. This enables a "virtual graph" combining real-time operational data from Spanner with historical analytics in BigQuery, without data movement.
For instance, combine real-time Account and User nodes from Spanner Graph with historical LogIn edges from BigQuery to identify suspicious login patterns across devices.
First, connect BigQuery to Spanner using the CREATE EXTERNAL SCHEMA statement:
- code_block
- <ListValue: [StructValue([('code', "CREATE EXTERNAL SCHEMA spanner\r\nOPTIONS (\r\n external_source = 'google-cloudspanner:/projects/PROJECT_ID/instances/INSTANCE/databases/DATABASE',\r\n location = 'LOCATION'\r\n);"), ('language', ''), ('caption', <wagtail.rich_text.RichText object at 0x7f0a21306cd0>)])]>
Next, define a BigQuery Graph incorporating tables from both Spanner and BigQuery:
CREATE OR REPLACE PROPERTY GRAPH bigquery.FinGraph
NODE TABLES (
  -- Account and Person are stored in Spanner,
  -- made available in BigQuery through the `CREATE EXTERNAL SCHEMA` statement.
  spanner.Account KEY (account_id),
  spanner.Person KEY (person_id),
  -- Media is stored in BigQuery.
  bigquery.Media KEY (media_id)
)
EDGE TABLES (
  -- Transfers and Owns are stored in Spanner.
  spanner.Transfers AS Transfers
    KEY (transfer_id)
    SOURCE KEY(account_id) REFERENCES Account
    DESTINATION KEY(target_account_id) REFERENCES Account,
  spanner.Owns AS Owns
    KEY (person_id, account_id)
    SOURCE KEY(person_id) REFERENCES Person
    DESTINATION KEY(account_id) REFERENCES Account,
  -- LogIn is stored in BigQuery.
  bigquery.LogIn AS LogIn
    KEY (login_id)
    SOURCE KEY(media_id) REFERENCES Media
    DESTINATION KEY(account_id) REFERENCES Account,
);
With the graph defined, you can now execute a query against BigQuery Graph that spans data held in both Spanner (accounts, persons, transfers, ownership relationships) and BigQuery (logins, devices). The example below identifies potentially suspicious login activity by tracing paths from blocked media devices through to account owners:
GRAPH bigquery.FinGraph
MATCH p=(owner:Person)-[:Owns]->
    (:Account)<-[login:LogIn]-
    (media:Media {blocked: true})
RETURN TO_JSON(p) AS full_path
ORDER BY login.time
LIMIT 20;
3) Export BigQuery data into Spanner Graph through reverse ETL
When analytical results need to feed back into Spanner for low-latency, real-time querying, reverse ETL eliminates the need for custom pipelines. The following example pushes historical device data — IP addresses, device IDs — from BigQuery into Spanner Graph, enriching real-time fraud detection with broader historical context:
EXPORT DATA
  OPTIONS (
    uri = 'https://spanner.googleapis.com/projects/PROJECT_ID/instances/INSTANCE/databases/DATABASE',
    format='CLOUD_SPANNER',
    spanner_options="""{ "table": "Media" }"""
  ) AS
SELECT * FROM Media;
4) Visualize your graph data
Effective graph analysis depends on being able to see the connections. Spanner Studio and BigQuery Studio (coming soon) let you visualize graph query results directly within your existing environment, with no external tooling required. For more programmatic exploration, both Spanner Graph notebooks and BigQuery notebooks can render graph results inline within standard data science workflows.

5) Graph visualization partner integrations
Beyond Google's native tooling, Spanner Graph and BigQuery Graph connect with a set of specialized third-party visualization platforms:
-
Kineviz: Delivers cutting-edge visual exploration and advanced analytics through its GraphXR platform.
-
Graphistry: Applies GPU-accelerated graph intelligence to extract meaningful insights from large, complex datasets.
-
G.V(): Provides a lightweight, quick-to-deploy client for high-performance visualization and no-code data exploration.
-
Linkurious: Specializes in detecting and analyzing threats hidden within large volumes of connected data via Linkurious Enterprise.
One unified solution for all your graph needs
Spanner Graph and BigQuery Graph together address both operational and analytical requirements across a broad range of industries:
| Domain | Spanner Graph | BigQuery Graph |
|---|---|---|
| Financial Services | Instantly blocks anomalous, suspicious transactions. | Uncovers complex, long-term fraud rings. |
| Retail & E-commerce | Serves personalized product recommendations on the fly. | Analyzes vast purchasing histories to predict demand. |
| Cybersecurity | Isolates active threats and traces attack origins instantly. | Models historical vulnerabilities to strengthen defenses. |
| Healthcare | Powers clinical decision support systems at the point of care. | Analyzes population health trends and disease risk factors. |
| Supply Chain | Tracks goods globally and alerts teams to immediate disruptions. | Identifies systemic bottlenecks to optimize future routing. |
| Telecommunications | Creates a network digital twin for real-time anomaly detection and root cause analysis. | Analyzes traffic patterns at scale to inform future infrastructure planning. |
Get started with Spanner Graph and BigQuery Graph today
Spanner Graph and BigQuery Graph are designed to work together, giving teams a unified graph data management experience that spans both operational and analytical workloads.
To dig in, explore Spanner Graph's use cases and setup guide for operational deployments, and the BigQuery Graph overview and creation guide for analytical use cases. For the full picture of how the two products work in tandem, consult the unified solution guide and work through the hands-on codelab.