More than 80% of enterprise data exists in unstructured form — PDFs, emails, reports, regulatory filings. These sources routinely contain critical business intelligence, yet extracting and reasoning over them at scale remains a persistent challenge. BigQuery Graph and Kineviz GraphXR address this directly by combining into a single, streamlined workflow that surfaces hidden insights from unstructured data. BigQuery handles graph construction and storage; GraphXR gives analysts an interactive visual environment to verify relationships, trace findings to their sources, and answer business questions on the fly.
Retrieval-augmented generation (RAG) and vector search have become the default approach for querying unstructured data — but they have limitations. For trend analysis, cross-entity comparison, multi-hop reasoning, and explainable decision support, graph structures offer meaningful advantages by preserving context and mapping relationships explicitly. This "evidence-first" knowledge graph approach prioritizes the nuance of original source material and maintains full traceability for every element in the graph, making results both verifiable and trustworthy. What follows is a concrete example of how BigQuery AI Functions, BigQuery Graph, and Kineviz GraphXR can answer real business questions about Fortune 500 SEC filings — without complex ETL pipelines, data duplication, or separate graph databases.
From fragmented to unified with BigQuery
Traditional unstructured analytics pipelines tend to be sprawling and brittle. A typical setup involves object storage for raw files, a custom parsing service, a separate AI extraction layer, a standalone graph database, and a BI tool for final analysis. Each handoff introduces synchronization overhead, potential failure points, and the ever-present risk of stale or duplicated data.
BigQuery consolidates this stack considerably. Raw documents live in Google Cloud Storage, while text extraction, Gemini-powered inference, and graph creation all execute within the same platform. There is no data movement between systems, no complex service orchestration, and no risk of out-of-sync copies accumulating across environments.
The result is a pipeline that is simpler to maintain, offers full data provenance, and requires no bespoke infrastructure to sustain.
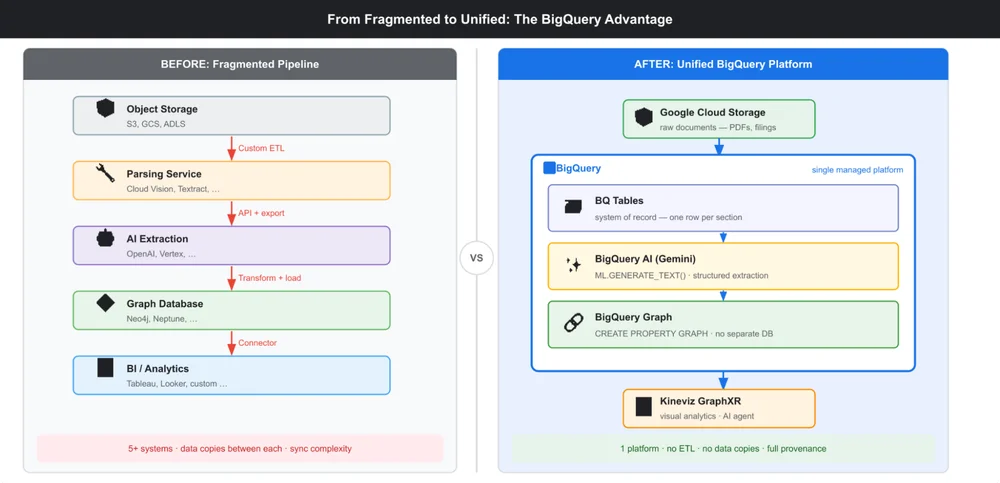
BigQuery pipeline: From unstructured to structured
To demonstrate the approach, we used BigQuery to explore SEC 10-K filings from Fortune 500 companies spanning 2020 to 2024. Each filing runs roughly 100 pages of dense, descriptive content.
The schema was designed so that each Company connects to Competitors (COMPETES_WITH), Risks (FACES_RISK), and Markets (ENTERING / EXITING / EXPANDING). Extraction followed a four-step process.
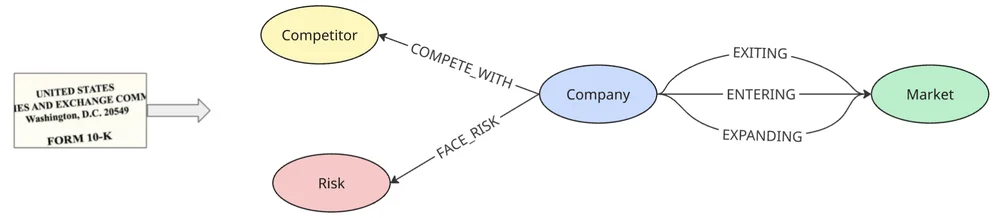
1. Ingest and parse. 10-K filings are retrieved from SEC EDGAR, converted from Standard Generalized Markup Language (SGML) to Markdown while preserving hierarchical structure, and loaded as raw text into BigQuery via Cloud Storage.
2. Focus on key signal sections. Rather than processing entire 100-page filings, extraction targets only the sections most relevant to market positioning, risk exposure, and competitive activity — specifically the Business, Risk Factors, and MD&A sections. Every row in BigQuery retains essential metadata: year, company name, CIK, section ID, and a direct URL to the original SEC filing.
3. Gemini for extraction. Using AI.GENERATE_TEXT() with Gemini 1.5 Pro, each section is processed to return structured JSON detailing competitors, risks, market actions, and opportunities — with every element grounded by verbatim evidence text from the source filing. This runs entirely within BigQuery, with no external orchestration or data movement required.
4. Declaring the graph. The structured JSON is decomposed into separate node and edge tables, then mapped into a fully traversable property graph using a single Data Definition Language (DDL) statement, as shown below — enabling graph queries without any joins.
- code_block
- <ListValue: [StructValue([('code', 'CREATE PROPERTY GRAPH sec_filings.SecGraph\r\n NODE TABLES (\r\n nodes_company, nodes_competitor, nodes_risk, nodes_market, nodes_opportunity\r\n )\r\n EDGE TABLES (\r\n edges_competes SOURCE nodes_company DESTINATION nodes_competitor LABEL COMPETES_WITH,\r\n edges_faces_risk SOURCE nodes_company DESTINATION nodes_risk LABEL FACES_RISK,\r\n edges_entering SOURCE nodes_company DESTINATION nodes_market LABEL ENTERING\r\n -- plus EXITING, EXPANDING, PURSUING\r\n );'), ('language', ''), ('caption', <wagtail.rich_text.RichText object at 0x7f0a0dacf880>)])]>
The pipeline extracted 87,000 entities and more than 20,000 competitor mentions. After entity resolution and normalization, those mentions consolidated into approximately 8,100 distinct competitors — transforming years of unstructured SEC filings into a queryable competitive intelligence graph.
Unlocking hidden insights with Kineviz GraphXR
GraphXR connects directly to BigQuery Graph, giving analysts an interactive environment to explore the data visually. Through low-code workflows, strategy, compliance, and research teams can navigate relationships, drill into subgraphs, and refine their analyses without writing a single query.
GraphXR's AI-assisted workflows let users define analytical tasks in plain language — for example, "show me Apple's competitive trajectory over time" — generating dashboards that stay linked to a live graph view. As the graph changes, charts update dynamically. One finding that emerges from this approach: the number of Fortune 500 companies citing Apple as a competitor has remained relatively stable at around 14 per year — a pattern that would be nearly impossible to detect by reviewing individual filings sequentially.
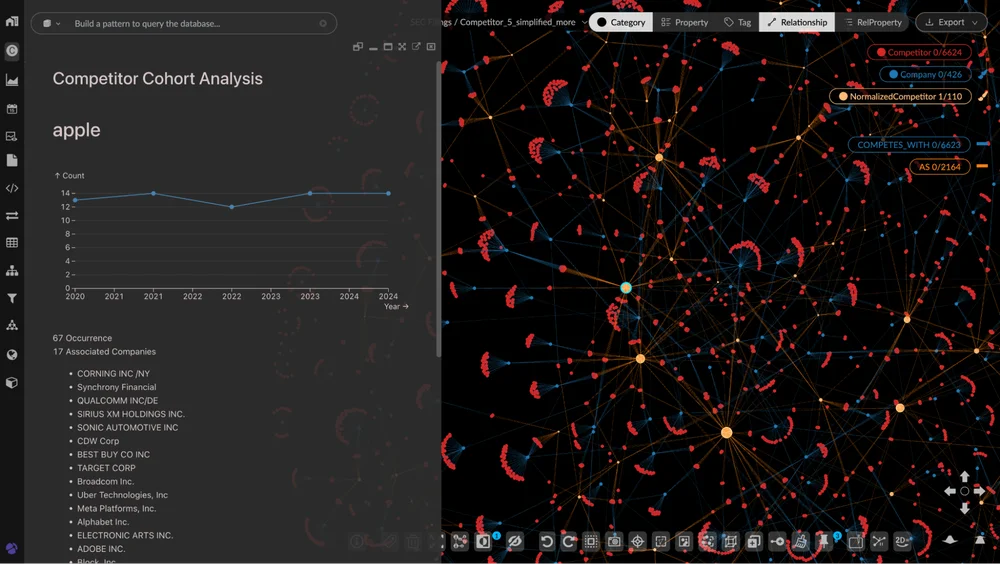
Dashboard: Companies Citing Apple Over Time
The AI-powered Visual Analysis Agent adds a further layer of interpretive depth. After using GraphXR's "trace neighbor" function to identify companies that cite Google as a competitor, the Agent surfaces complex cross-industry dynamics. A notable example: AES Corp., an energy utility, appears in contexts suggesting a coopetition relationship with Google — reflecting the broader market shift toward cloud and AI infrastructure adoption across traditional industries.
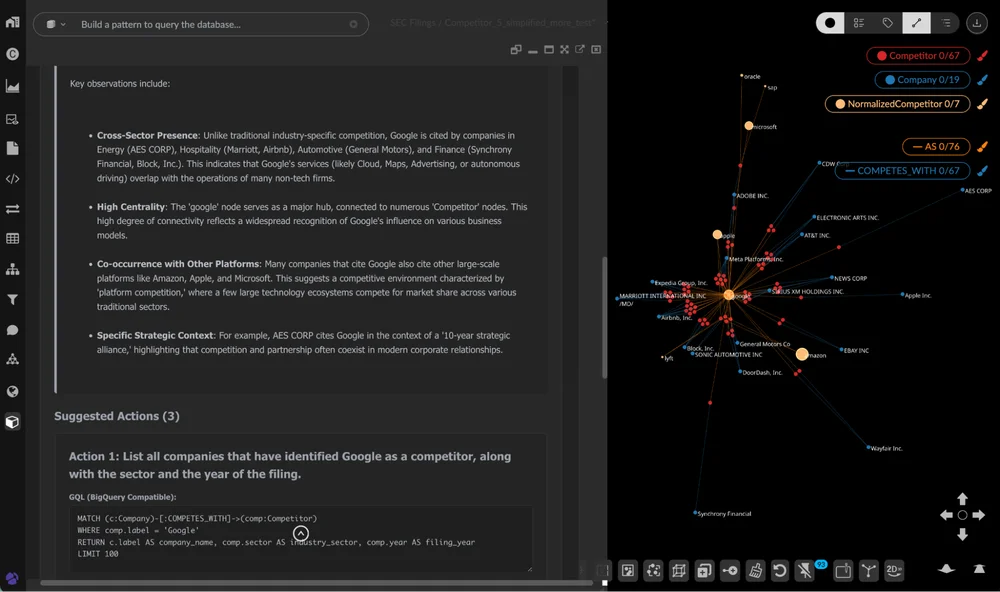
Competitive analysis with agent reasons over both graph structure and node properties
Auditability is built into the workflow from the start. Every node in the graph links directly to its location within the original SEC filing. Analysts can trace any insight back to its source and validate findings in context. Selecting a risk entity, for instance, surfaces a URL that navigates directly to the relevant passage in the source document where that risk was identified.
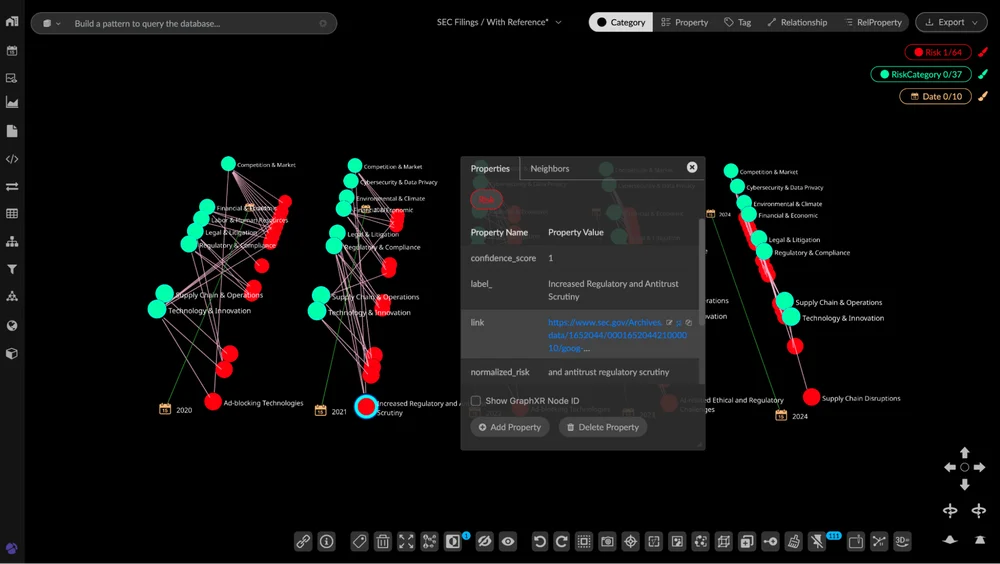
Risk analysis with a direct, clickable link to the precise location of the extracted information in the source document.
Why this matters
Together, BigQuery Graph and Kineviz GraphXR deliver four core advantages for enterprise data teams:
- Simplicity: Fewer systems, fewer copies — data stored in BigQuery flows directly into GraphXR for exploration and analysis, with no movement or duplication required across a fully managed, integrated platform.
- Scalability: BigQuery handles millions of documents and billions of extracted facts without the overhead of bespoke graph infrastructure.
- Explainability: Every insight traces back to its source evidence, with one-click validation built into the workflow.
- Flexibility: New questions or entity types can be accommodated by extending the schema — no need to rebuild the underlying extraction model from scratch.
Most enterprise knowledge remains locked inside unstructured data. BigQuery AI Functions, BigQuery Graph, and Kineviz BI tools together form an end-to-end pipeline that brings graph-based reasoning, evidence-first analytics, and interactive exploration into a single, streamlined workflow — surfacing the intelligence that would otherwise stay buried.
Get started
Learn more about BigQuery Graph in the official documentation or get started directly. Kineviz GraphXR is available on the Google Cloud Marketplace. To see the technology in action, explore the Fortune 500 tutorial via the GitHub notebook or watch the walkthrough video.
Related reading:
Related Reading
Mastering Lazy Loading: Boost Performance in React and Next.js Applications
Apr 14, 2026
The Data Quality Handbook: Data Errors, the Developer's Role, and Validation Layers Explained.
Apr 14, 2026
United States Residential Proxies: How Local IP Precision Enhances SERP Analysis, Ad Verification, and Price Intelligence
Apr 14, 2026