BigQuery Graph is now available in preview, bringing scalable graph analytics directly into BigQuery. This new capability enables data engineers, analysts, scientists, and AI developers to model, analyze, and visualize complex relationships at massive scale without leaving their existing data warehouse.
Understanding how entities—people, places, products—connect to each other unlocks deeper insights from your data. Traditional SQL struggles with these relationship queries: finding a "friend of a friend of a friend" requires nested JOINs that become difficult to write and exponentially slower as data grows. Analyzing supply chain disruptions across multiple hops demands full-scale graph traversal. Graph data models excel at uncovering these complex, hidden relationships that relational structures miss.
Why enterprises struggle with graph technology
Despite graph technology's proven value in fraud detection, recommendation engines, supply chain management, and knowledge graphs, adoption faces significant barriers:
- Data silos and maintenance overhead: Standalone graph databases force you to duplicate and synchronize data, creating inconsistency, additional costs, and operational burden.
- Lack of graph expertise: Learning new query languages and paradigms means your team's SQL expertise goes underutilized.
- Performance and scalability concerns: Many graph databases handle small-scale traversals well but fail when scaling to billions of entities.
BigQuery Graph eliminates these obstacles through:
- Built-in graph query experience: Query using GQL (Graph Query Language), an intuitive syntax based on the new ISO GQL standard, designed specifically for finding patterns and traversing relationships.
- Unified relational and graph data models: Work with both paradigms on a single source of truth. Full interoperability between GQL and SQL means you leverage existing skills while gaining graph query expressiveness—no data duplication or movement required.
- Graph over structured and unstructured data: Combine graph queries with AI functions, vector search, and full-text search to bridge structured and unstructured data using semantic meaning and keywords.
- Graph visualization: Explore and investigate connections visually through BigQuery Studio notebooks and Jupyter Notebook.
- Industry-leading ease of use, performance and scalability: Built on BigQuery's serverless, distributed analytics engine, scaling effortlessly to billions of nodes and edges.
- Integration with Spanner Graph: Use a unified graph schema and query language across real-time (Spanner Graph) and batch analytics (BigQuery Graph). Build virtual graphs combining live Spanner data with historical BigQuery data via federated queries.
- Chat with your graph: Soon you'll query graphs conversationally using the Conversational Analytics Agent.
Common BigQuery Graph use cases
BigQuery Graph enables intelligent applications across industries:
- Financial fraud detection: Uncover suspicious patterns like money laundering by analyzing complex relationships among users, accounts, and transactions—connections that relational databases struggle to surface.
- Customer 360: Map customer relationships, preferences, and purchase histories for personalized recommendations, targeted campaigns, and enhanced service experiences.
- Social networks: Model user activities and interactions for friend recommendations and content discovery through graph pattern matching.
- Manufacturing and supply chain management: Perform efficient stockout analysis, cost rollups, and compliance checks by modeling parts, suppliers, orders, availability, and defects as graph relationships.
- Healthcare: Connect patients, conditions, diagnoses, and treatments to enable patient similarity analysis and treatment planning.
- Transportation optimization: Model locations, connections, distances, and costs to identify optimal routes through graph queries.
BigQuery Graph in the real world
Early adopters are already applying BigQuery Graph to solve critical business challenges:
BioCorteX: drug discovery
"Understanding disease isn't about collecting more data; it's about understanding the relationships within that data. By leveraging pathway search in BigQuery Graph at a massive scale, reaching depths of 7+ hops, we are finally able to see more of the human metabolism map. This level of scale is what allows us to move beyond trial and error, identifying the precise biological levers that need to be pulled to cure complex diseases. We aren't just guessing anymore, we're emulating life at the speed of compute." - Nik Sharma, CEO and Cofounder, BioCorteX
Curve: fraud detection
"By implementing BigQuery Graph, we have successfully moved away from the previous limited SQL-based approach to a more scalable solution for fraud detection network analysis. This has allowed us to detect sophisticated fraud networks by uncovering hidden connections between seemingly unrelated accounts and transactions. This transition from traditional relational queries to graph-based analytics has showcased measurable business impact with approximately £9.1M of savings. This shift has not only improved the precision of fraud detection but has also provided a scalable foundation for protecting the ecosystem without adding significant operational overhead."
Francis Darby, VP Data & ML, Curve
Virgin Media O2: Fraud Detection
"At Virgin Media O2, we are constantly evolving our defenses to stay ahead of increasingly sophisticated fraud networks. We've added a powerful new layer to our already robust fraud alerting system. Using BigQuery Graph, we can now execute complex 4-hop queries that map the hidden relationships between accounts, devices, and activities. This deeper visibility allowed us to identify networks of suspicious addresses. This doesn't just catch fraud; it acts as an early warning system, flagging new connections to known risk networks before they can cause damage."
Jonathon Ford, Director Data Applications, Virgin Media O2
How to Use BigQuery Graph
BigQuery Graph represents a fundamental shift in how you can approach data analysis, enabling you to ask more complex questions, uncover deeper insights, and tackle challenging problems that traditional relational queries struggle to address.
Getting started requires just three steps:
Step 1: Create graph schemas on top of your existing relationship tables using DDL—no data duplication required.
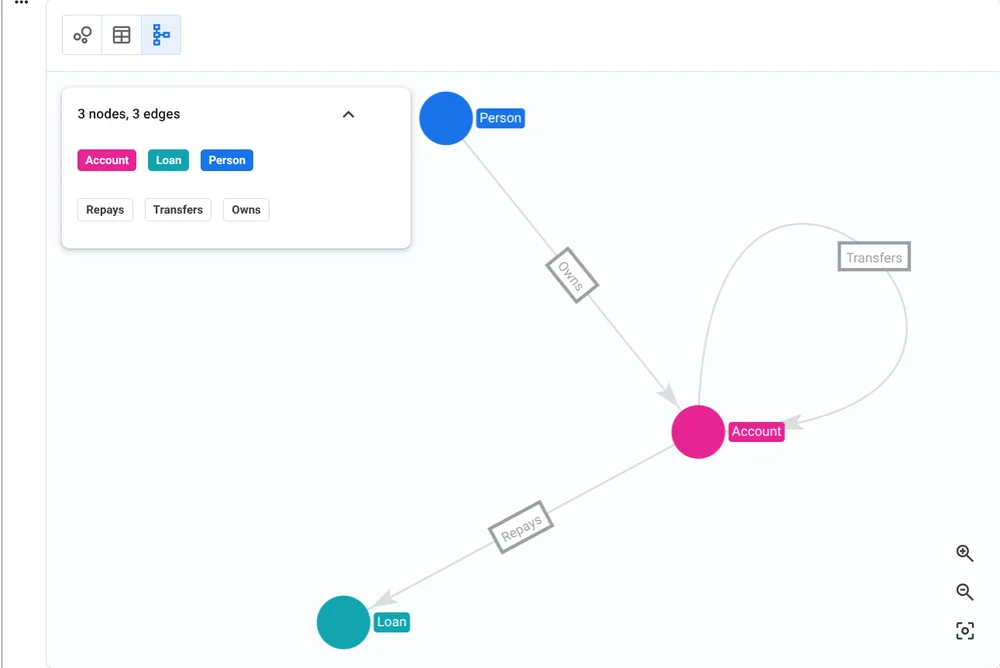
For example, you can create a finance graph by mapping relational tables into "Account", "Person", and "Loan" nodes, with their relationships represented as "Transfers", "Owns", and "Repays" edges.
- code_block
- <ListValue: [StructValue([('code', 'CREATE PROPERTY GRAPH graph_db.FinGraph\r\nNODE TABLES (\r\n graph_db.Account KEY(id),\r\n graph_db.Person KEY(id),\r\n graph_db.Loan KEY(id)\r\n) \r\nEDGE TABLES (\r\n graph_db.Transfers \r\n KEY (id, to_id, timestamp) \r\n SOURCE KEY (id) REFERENCES Account (id)\r\n DESTINATION KEY (to_id) REFERENCES Account (id), \r\n graph_db.Owns\r\n KEY (id, account_id, timestamp) \r\n SOURCE KEY (id) REFERENCES Person (id)\r\n DESTINATION KEY (account_id) REFERENCES Account(id),\r\n graph_db.Repays\r\n KEY (id, loan_id, timestamp) \r\n SOURCE KEY (id) REFERENCES Person (id)\r\n DESTINATION KEY (loan_id) REFERENCES Loan(id)'), ('language', ''), ('caption', <wagtail.rich_text.RichText object at 0x7f0a2339f580>)])]>
Step 2: Use intuitive SQL/GQL syntax to traverse data relationships and discover hidden connections.
For instance, to find the accounts owned by Jacob and the loans he repays from those accounts:
- code_block
- <ListValue: [StructValue([('code', 'GRAPH graph_db.FinGraph\r\nMATCH\r\n (person:Person {name: "Jacob"}) \r\n -[own:Owns]->(account:Account)\r\n -[repay:Repays]->(loan:Loan)\r\nRETURN\r\n account.id AS account_id,\r\n loan.id AS loan_id'), ('language', ''), ('caption', <wagtail.rich_text.RichText object at 0x7f0a2339fee0>)])]>
You can also combine vector search with graph traversals to identify fraudster-like accounts and their transfer activities within 1-6 hops:
- code_block
- <ListValue: [StructValue([('code', "DECLARE similar_account_to_fraudster DEFAULT ((\r\n SELECT array_agg(base.id)\r\n FROM VECTOR_SEARCH(TABLE graph_db.Account, 'embedding',\r\n (SELECT * FROM graph_db.Account WHERE id=102), 'embedding', \r\n top_k => 6)\r\n));\r\nGRAPH graph_db.FinGraph\r\nMATCH\r\n (person:Person)-[own:Owns]->\r\n (account:Account)-[transfer:Transfers]->{1,6}\r\n (to_account:Account)\r\nWHERE to_account.id IN \r\n UNNEST(similar_account_to_fraudster)\r\nRETURN\r\n person.id AS person_id,\r\n account.id AS src_account,\r\n to_account.id AS to_account"), ('language', ''), ('caption', <wagtail.rich_text.RichText object at 0x7f0a2339ff40>)])]>
Step 3: Visualize graph results to detect connectivity across disparate data in a more intuitive way using BigQuery Studio notebooks.

For more specialized graph visualization capabilities, BigQuery Graph integrates with industry-leading partners including G.V(), Graphistry, Kineviz, and Linkurious. These tools let you visualize BigQuery Graph query results outside the Google Cloud console.
Ready to Get Started?
The future of data analysis is connected. With BigQuery Graph, you can unlock that connectivity and transform your business with actionable insights grounded in your enterprise knowledge. Start exploring today and unleash the power of your data's interconnected relationships.
- Visit the BigQuery documentation: Find the overview and quickstart guide.
- Explore tutorials: Get hands-on experience with BigQuery Graph through tutorials.
- Share your feedback: Join our community, and get your questions answered via [email protected].
- Related blogs:
Related Reading
Mastering Lazy Loading: Boost Performance in React and Next.js Applications
Apr 14, 2026
The Data Quality Handbook: Data Errors, the Developer's Role, and Validation Layers Explained.
Apr 14, 2026
United States Residential Proxies: How Local IP Precision Enhances SERP Analysis, Ad Verification, and Price Intelligence
Apr 14, 2026